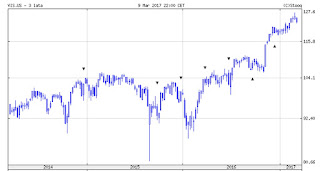
Where are we on the economic cycle graph? This question is asked by many because of long lasting recovery after banking crisis 2008 do not convince many that it is for real.
Phase 1, Early Recovery. The economy is improving from the last recession. Sales and profits may be still low, but are improving, and the labor market is also improving. Output and production levels are stabilizing or possibly increasing.
Phase 2, Late Recovery. The economy is operating above its long-term trend. Generally, businesses and consumers are doing well and are optimistic about the economy. Output and production are high. Consumers of goods and services may see prices begin to increase more than usual. Unemployment is low and production is booming. The top of this phase is known as the “peak” of the economic cycle.
Phase 3, Early Recession. The recession begins as production slows down. The rate of consumption begins to decline, and unemployment begins to rise. Very often stock market is crushing.
Phase 4, Late Recession. The economy is in a downturn with contracting business volumes and profit. Production is declining, businesses go bankrupt. The bottom of this phase is known as the “trough” of the cycle.
And if we have a look at production machining Index it is clear in my opinion that we are somewhere between early and late recovery. FED monetary policy of keeping rates low and buying government securities made the present cycle unlike others but still it looks that economy and production have plenty space to grow. Specially recent break out in production machining charts is indication that we may see another leg up. The situation of manufacturers improved significantly after Trump's victory. Small production machining job shops as AC Manufacturing see pick up in orders. Manufacturing activity is yet to rise dramatically before we can call it late recovery.
But also keep in mind that because economic data is reported on a delay, we won’t have proof that we have entered a new cycle until after the new data emerge.


